
See How It Works
REMS vs. DEXA - What's the Difference?
Sample Reports
Every scan includes a clear, easy-to-read digital report, like the examples below.
Spine Densitometry Report
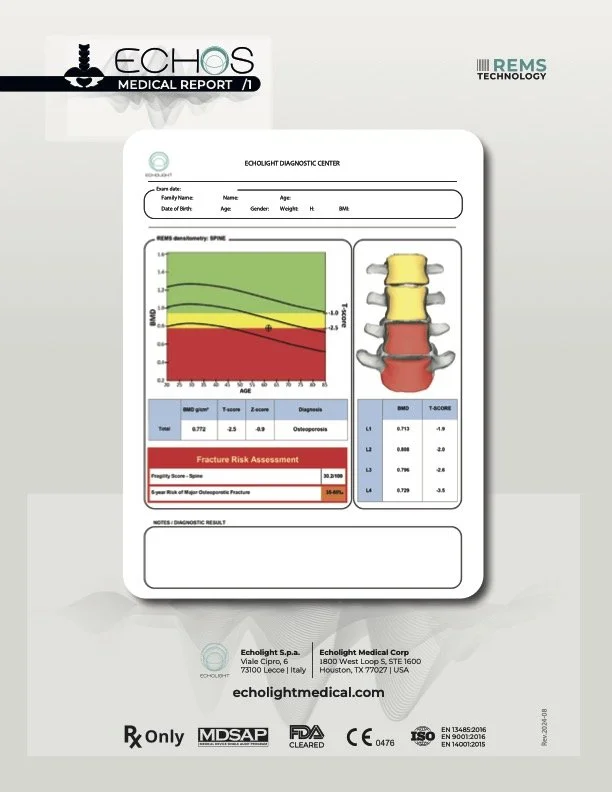
Your spine scan shows bone mineral density (BMD) and T-score across the L1–L4 vertebrae, plotted against age-based reference ranges, with an overall diagnosis category.
Fragility Score — Spine
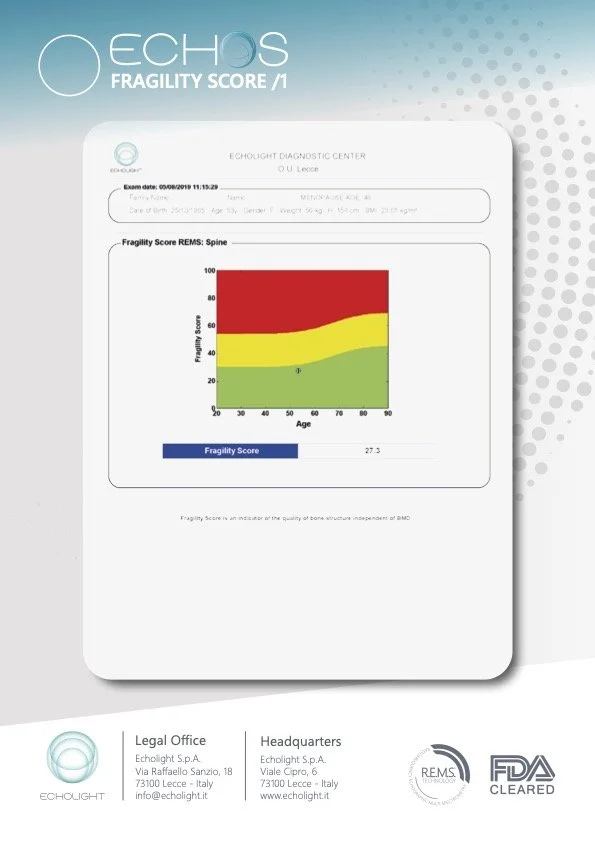
Beyond density alone, the Fragility Score reflects the underlying quality of your bone structure, shown against age-based normal ranges.
Femur Densitometry Report
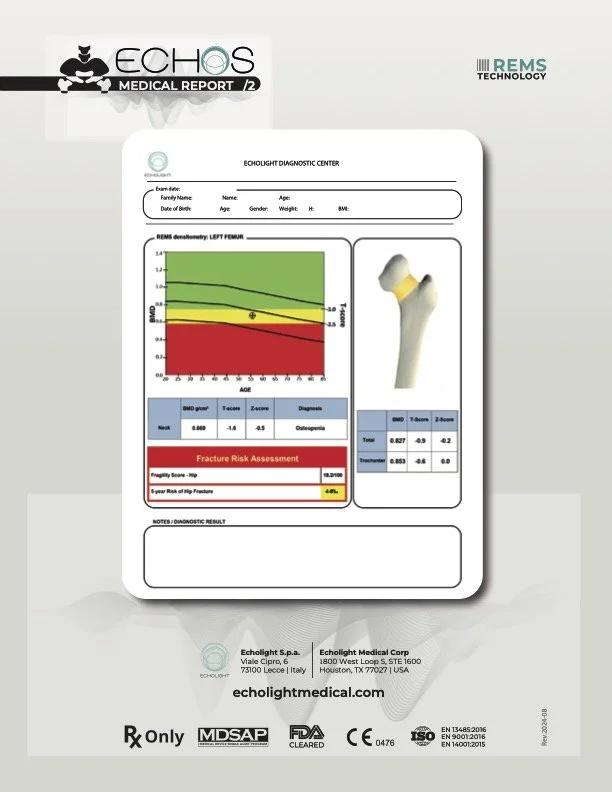
Your femur scan measures bone density at the hip (neck and trochanter regions), giving a T-score and diagnosis specific to that area — since bone density can vary by location in the body.
Fragility Score — Hip Fracture Risk
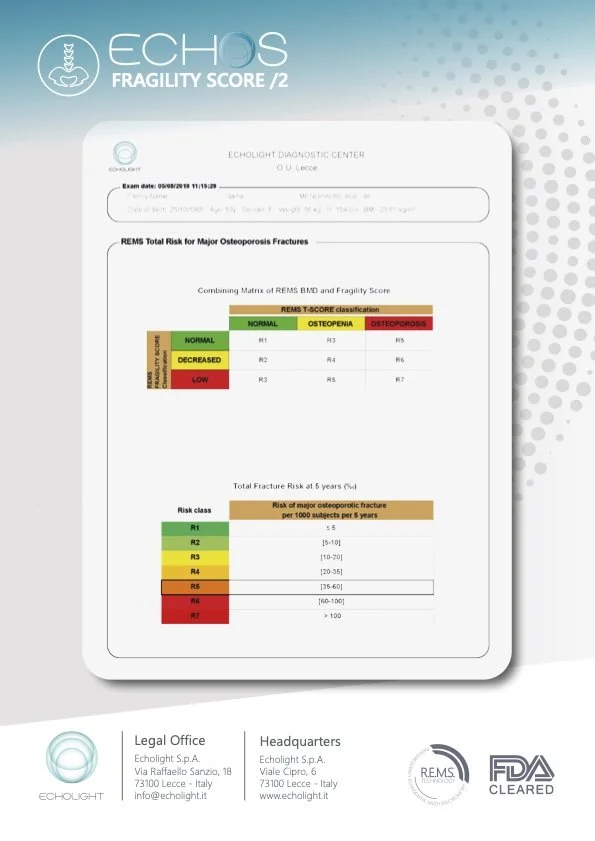
This report combines your BMD and Fragility Score into a 5-year risk estimate for major osteoporotic fracture, helping put your results into practical context.
Body Composition Report Sample
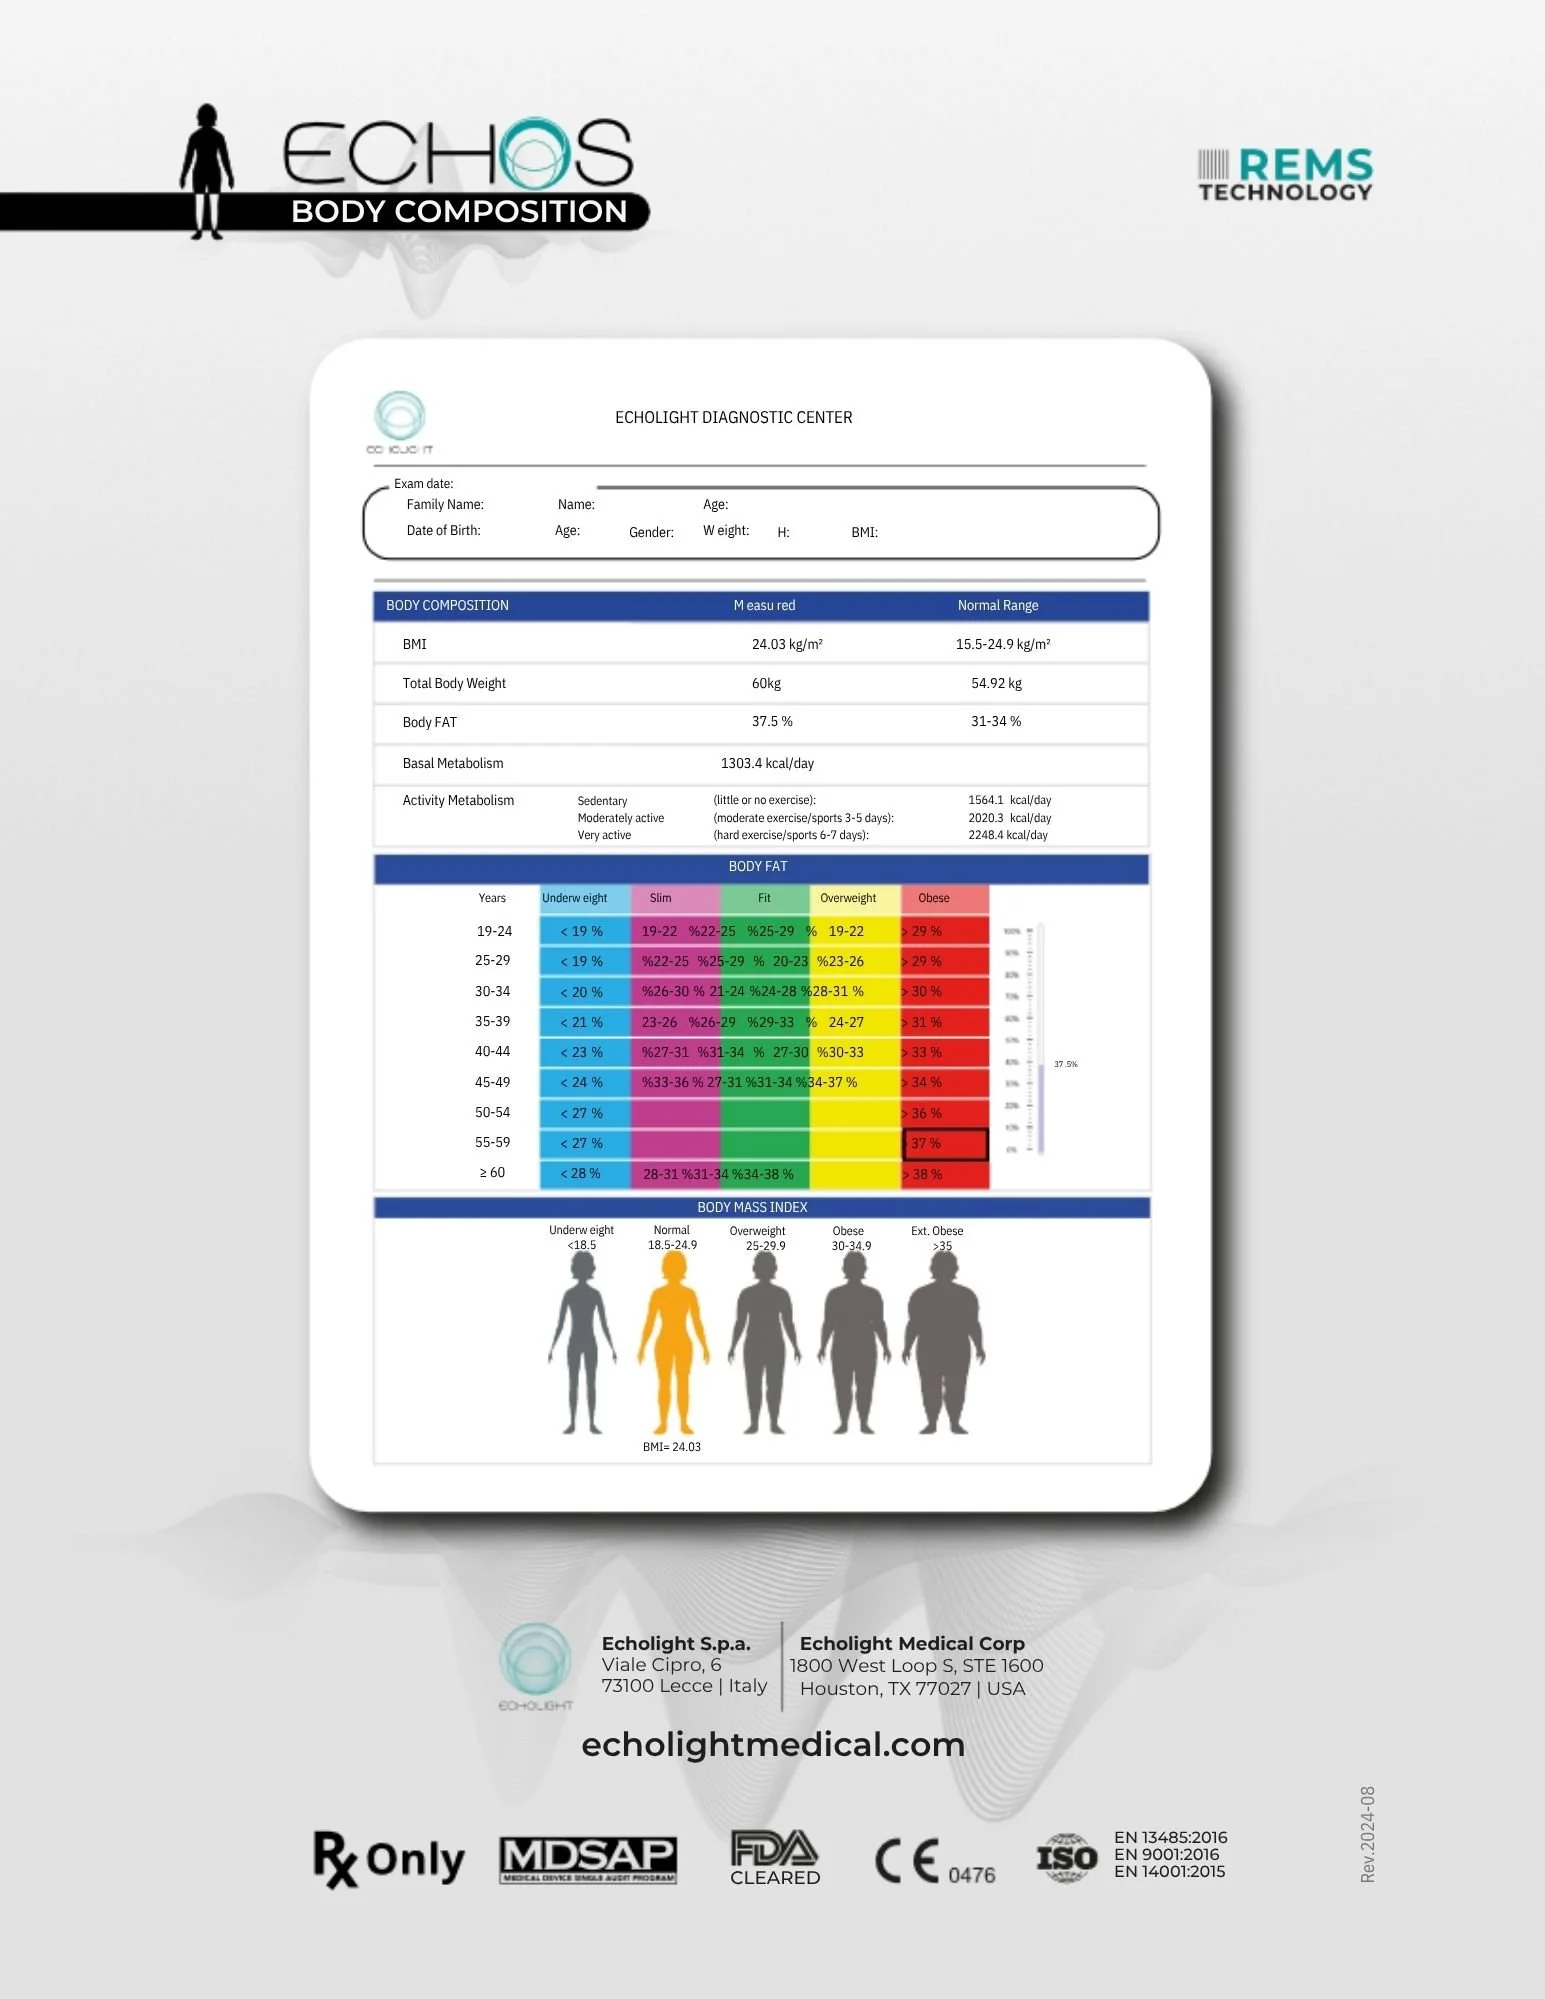
Your body composition scan measures BMI, total body weight, and body fat percentage, compared against age-based normal ranges. It also estimates your basal and activity-based metabolism, giving a fuller picture of overall health alongside your bone assessment.
The sample reports shown above are for illustrative purposes only, using template data, and do not represent an actual patient's results. Your own report will reflect your individual scan results. Results are screening assessments, not diagnostic. Discuss your results with your healthcare provider.
Curious how REMS technology works, or what your results will actually show? Watch how the EchoLight device performs a scan, see how it compares to traditional DEXA, then take a look at a sample report below.